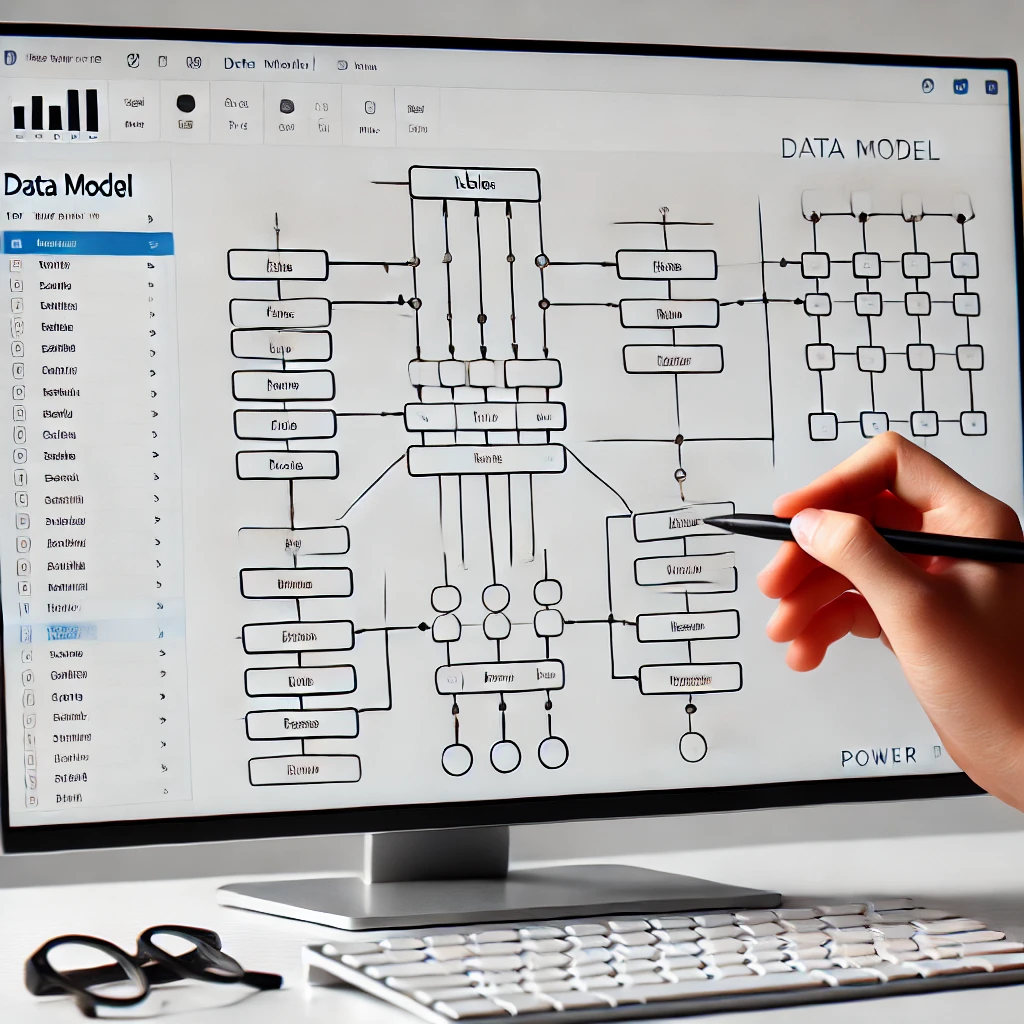
Power BI – Business Intelligence
DESCRIPCIÓN
En este curso aprenderás a transformar datos en información valiosa mediante el uso práctico de Power BI. A través de proyectos reales, desarrollarás habilidades para importar, modelar y visualizar datos, creando dashboards interactivos y reportes dinámicos. Durante el curso, aprenderás a optimizar tus análisis con técnicas avanzadas de visualización y a compartir reportes para la toma de decisiones empresariales. Este enfoque te permitirá aplicar los conocimientos directamente a tus proyectos profesionales, potenciando tu capacidad para analizar y presentar información de manera efectiva.
Competencias a Desarrollar

Importación y transformación de datos

Modelado de datos

Creación de visualizaciones dinámicas

Compartir y publicar reportes
Inscribite Aquí:
PROGRAMA DE CAPACITACIÓN
Programa de curso
- 5 Sections
- 4 Lessons
- 10 Semanas
Expand all sectionsCollapse all sections
- 1. Iniciando con Power Bi0
- 2. POYECTO 11
- 3. PROEYCTO 21
- 4. PROYECTO 31
- 5. PROYECTO 41

